In your Dashboard under the Sales tab, you can see which categories and items have been the best performing over your chosen time frame.

To view the percentage breakdown, hover over each category in the pie chart.

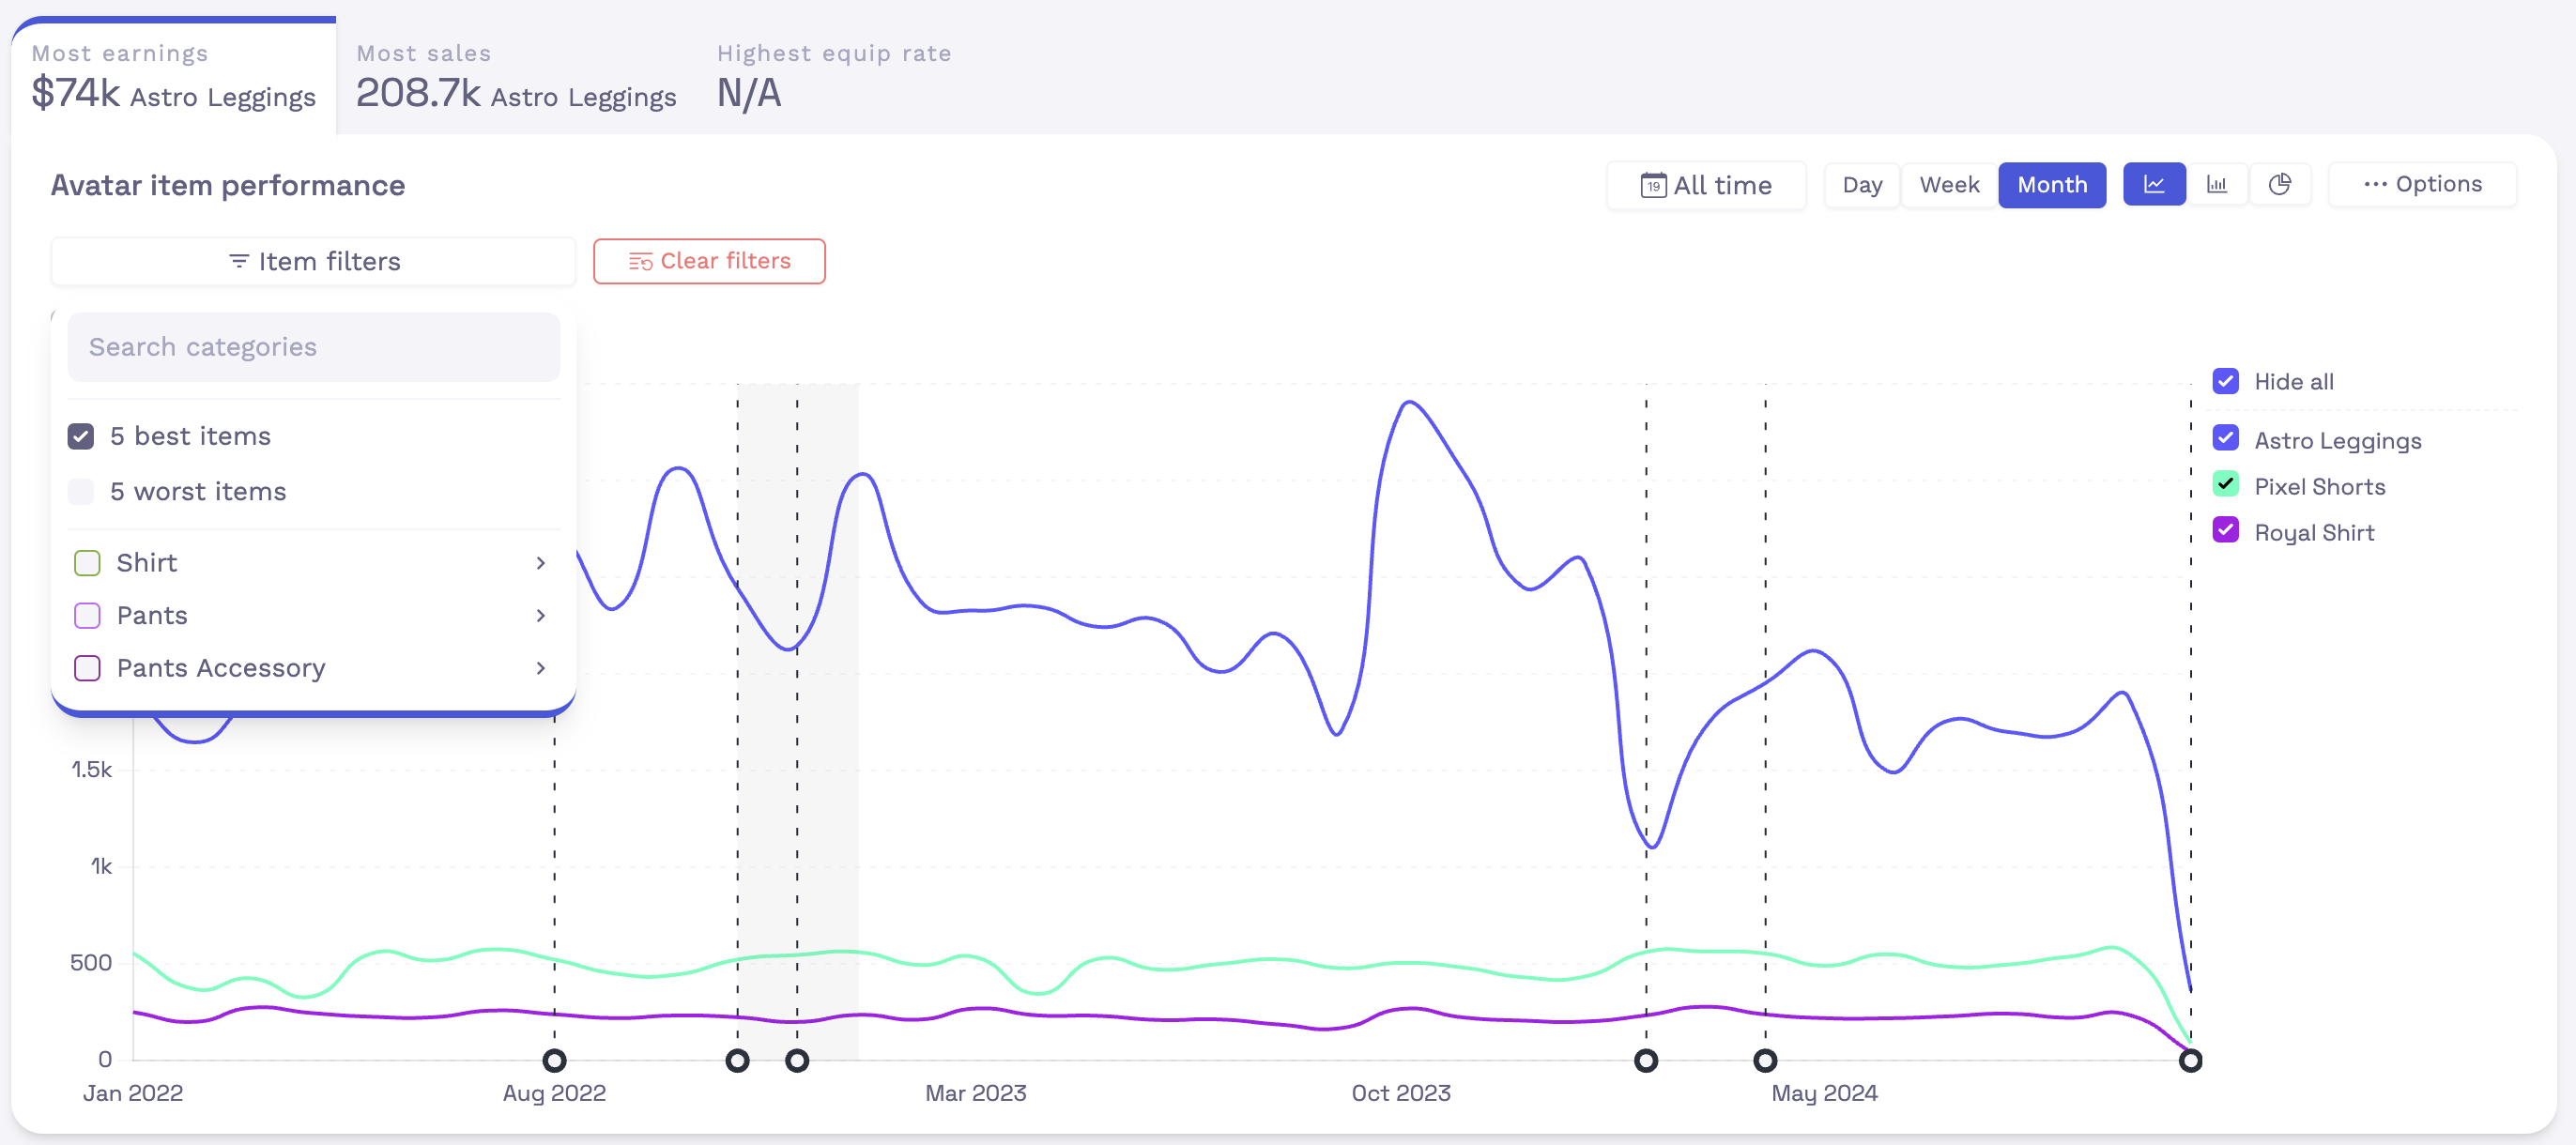
In the items chart, use Item filters to look at specific items, or the 5 best/worst performing.